Depending on the tab selected in the Information section, the available information is displayed in the main area.
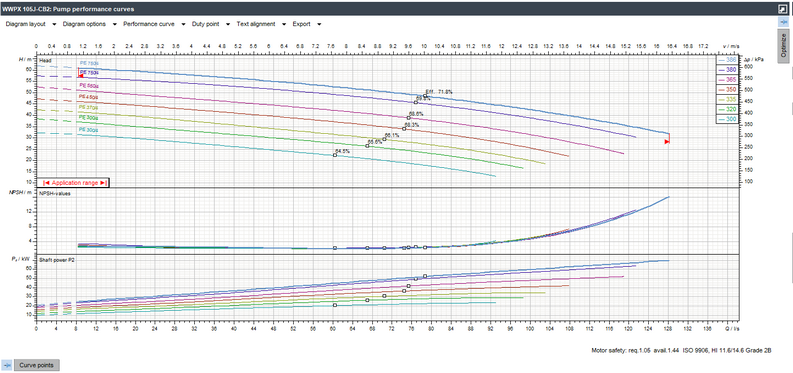
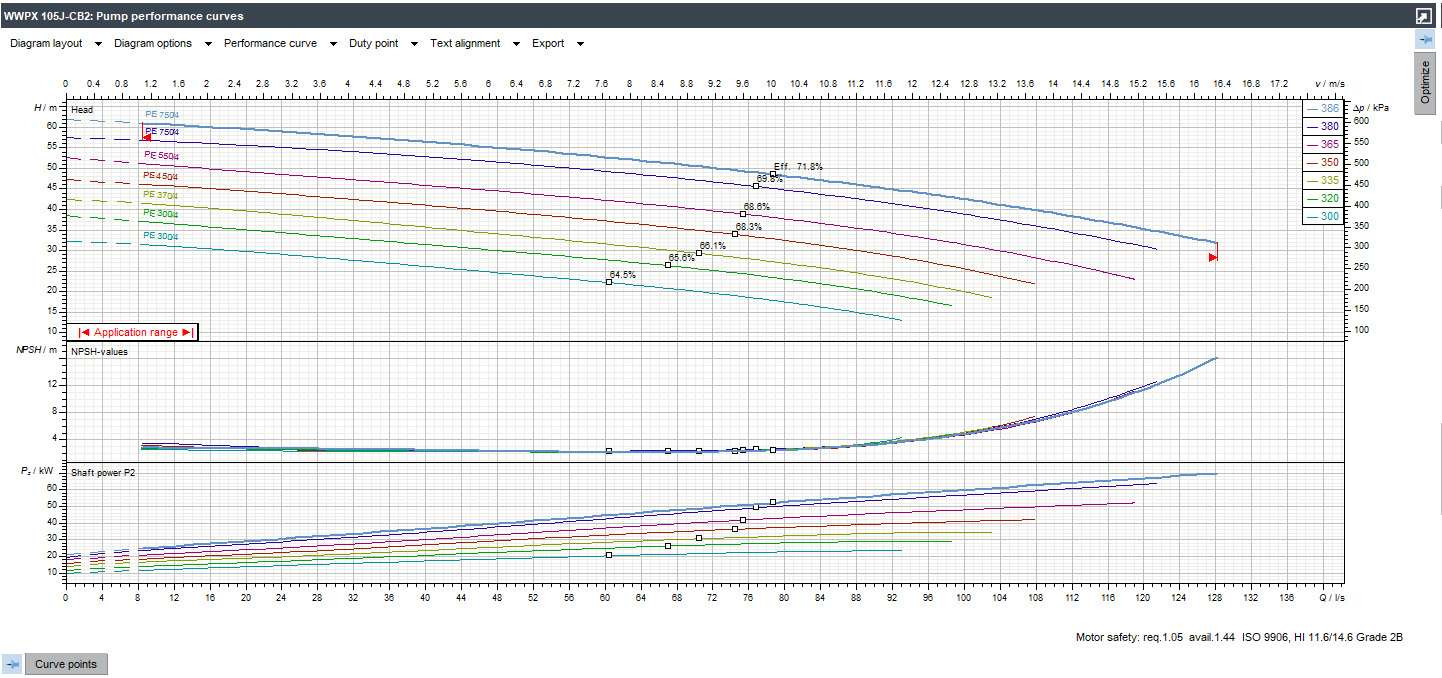
The view for the duty charts and performance curves provides information about the hydraulic properties of the selected pump. The area for viewing the pump performance curve is functionally the most extensive register of the display range. Besides the diagram, the Optimize and Curve Points sections are available here that allow for adjustments to duty points and the display of additional information and values respectively.
The diagram shows the hydraulic data of the selected pump in the given configuration.
To change this display, several menus are available above the diagram.
|
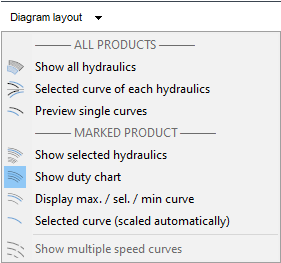
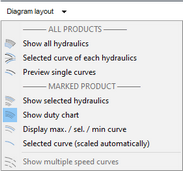
The Diagram layout menu is divided into two sections. In the upper ALL PRODUCTS area, you can choose between comparative displays for all pumps in the list.
This option displays all performance curve areas of the pumps in the list in the Q-H diagram. The currently selected pump is highlighted in color.
|
This display gives an overview of the maximum curves of all hydraulics of the pumps in the list. It shows all available diagram parts.
|
This display corresponds to the Selected curve of each hydraulics option, but shows the Q-H diagram only.
|
In the MARKED PRODUCT section below, you can choose between different representations for the currently selected pump.
This display shows the complete hydraulics of the selected pump with all associated duty charts. The currently active chart is highlighted, while the other charts are greyed out.
|
This setting displays the currently active duty chart.
|
This option displays the maximum, the currently active and the minimum performance curve of the current duty chart in the diagram.
|
This option restricts the view to the currently active performance curve.
|
This option displays the multiple speed curves.
|
|
|
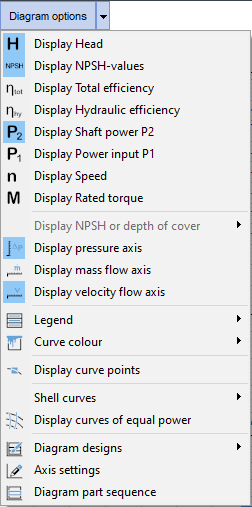
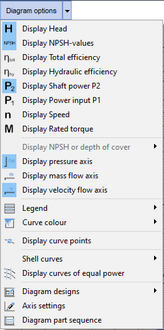
The Diagram options menu contains functions for displaying diagram components. This menu is also available as a popup after pressing the right mouse button when the mouse pointer is in the diagram.
The menu is divided into different sections.
In the upper section, you can define which of the diagram parts available for hydraulics are to be displayed or hidden.
Subsequently, you can click on the display of the pressure axis, mass flow axis and velocity flow axis to activate or deactivate it.
The following two menu items refer to the display of the legend and the colored display of the performance curves.
This submenu allows you to decide whether the diagram should include the legend for the curve captions. If the legend is activated, you can also define its position.
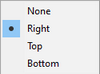
If the legend is not displayed (None), each performance curve is provided with a label.
|
This submenu can be used to determine whether the performance curves should be displayed in color or in a black and white outline.
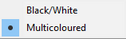
In the case of multicolor display, the presence or absence of the legend is a decisive factor. With the legend, each curve of the duty chart is given its own color. Without a legend, only the active performance curve is highlighted in color, while the other curves are drawn in gray.
|
The following option enables you to evaluate points of the active performance curve:
If this option is activated, values of the active performance curve can be displayed. For this purpose, blue markers become active on the curves, which move with the position of the mouse pointer. Clicking the left mouse button will snap these points to the current mouse position and open an information window with the values valid for the point.

Another click on the left mouse button releases the point, which follows the mouse movement again, and the information window disappears.
|
The lower area provides the option of displaying various additional elements in the diagram.

|
Depending on the data basis, not all functions are always available. If an option is not available, the corresponding entry in the menus is greyed out and cannot be activated.
|
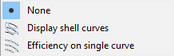
To show the efficiency in the Q-H diagram, you can have shell curves or the efficiencies displayed on the individual performance curves.
|
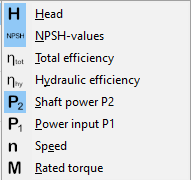
This option displays additional curves in the Q-H diagram that represent specific power values. This enables you to estimate the required power for certain points in the duty chart.
|
This option can be used to display an additional scale for the operating pressure at the right edge of the Q-H diagram. This display takes into account the properties of the pumped fluid.
|
Activating this option displays an additional X-axis for the mass flow.
|
|

|
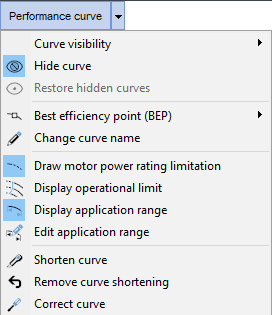
The Performance curve menu allows for settings related to the display of the individual performance curves. It is also divided into several sections.
The functions in the upper section refer to the physical properties of the performance curve.

This function hides the currently active performance curve. If this option is used, the next smaller curve is activated. Several curves can be hidden one after the other.
|
This option allows all curves that were previously hidden to be displayed again. The option is only available if curves were previously hidden.
|
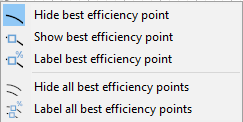
This submenu can be used to define the display and labeling for the best efficiency points.

The upper area contains the options for hiding, displaying and labeling the best efficiency point of the active curve. The lower area includes the corresponding options for all curves of the active duty chart.
|
This function allows changing the currently used curve name. This process is temporary, i.e. only relevant for the current project. The original name is retained in the database and is available again for the next selection.
|
The next section contains functions related to the display of operational parameters.
If this option is active, the performance curves are only displayed in the Q-H diagram as far as the power from the currently selected motor allows. The areas above this limit are displayed in dashed curves.
|
If this option is activated, the minimum permissible flow is drawn for the entire duty chart. The operating limit for a duty chart results from the minimum values of the application range of the individual performance curves. This limit is represented by a blue line.
|
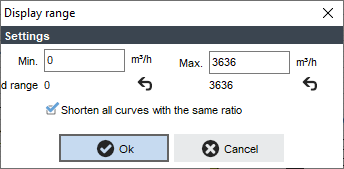
This function opens a dialog box in which you can change the display range of the performance curves.
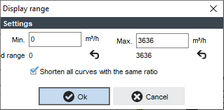
The limits for the new display can be specified in the Min. and Max. fields. These may not be below or above the allowed range, which is displayed below the edit fields.
The buttons can be used to undo the entry and restore the original state of the respective limit. buttons can be used to undo the entry and restore the original state of the respective limit.
If you activate the Shorten all curves with the same ratio option field, this action is transferred to all performance curves of the duty chart.
|
This function restores the original state of the duty chart.
|
The last function can be used to make changes to the application range of the performance curve.
This option activates the display of the application range. The latter is shown by two red marks in the Q-H diagram.
|
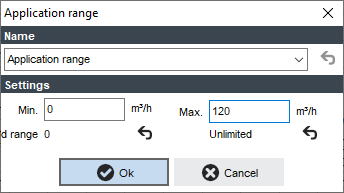
This function opens a dialog box in which you can define a new application range for the performance curve.
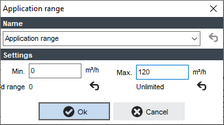
The Name combo box can be used to enter the description for the new area to be created.
The edit fields under Settings allow you to enter the new limits (min. and max.) of the range. The values may not exceed or fall below the previous allowed range, which is displayed below. The buttons can be used to reset the entered values to the original state.
|
|
|
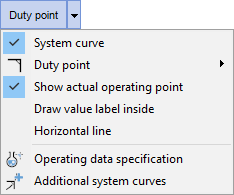
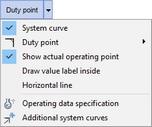
The Duty point menu contains options for displaying the specified operating points. This menu is likewise divided into several sections.
In the upper section, you can define the display type of the duty points.
This option enables only the system curves associated with the duty points to be displayed in the diagram. If the corresponding function is activated, the actual points will also be displayed.
|
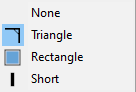
This is where the display type of the duty points is defined. The following options are available:

|
This option allows the display of the actual operating points.
|
This option labels all duty point values for all diagram parts in the diagram.
|
If this option is activated, the duty points are displayed as right angles (triangle) and supplemented by a horizontal line in the Q-H diagram.
|
In the lower section, you can specify additional data to be displayed in the diagram.
This function can be used to add or remove further duty points in the Duty point data dialog. The function is described in chapter Operating Data Specification Area.
|
This function opens a dialog in which you can create additional system curves to be displayed.
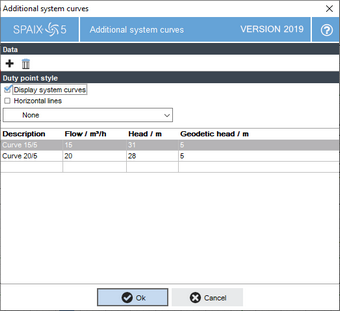
First, define a description for the curves. Then specify a reference point with the flow and the head. Afterwards, specify the geodetic head.
Use the options under Duty point style to select the curve style to be displayed. The menu items correspond to those of the first section of the Duty point menu described here. However, both menus are independent of each other, which allows for differences in the display of duty point system curves and additional system curves.
|
The Style button shows the currently applied display style for the additional system curves and changes the appearance when the style is changed.
|
|
|
|
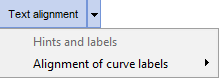
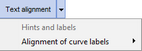
The Text alignment menu refers to labels of the performance curves and the displays of the curve point data.
This submenu can be used to define the position of the hint window, which contains the curve point data.
|
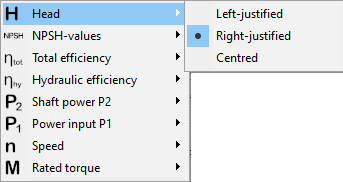
The settings made in this submenu are only effective if the show Legend option has been activated. Here, you can specify the positions of the performance curve labels. This can be done separately for each diagram part to be displayed.
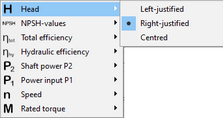
|
|
|
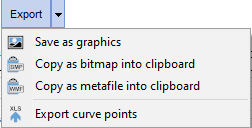
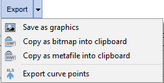
The Export menu allows the diagram to be saved as a graphic in a file or to be copied to the clipboard.
This function opens the Save as graphics dialog where you can select the target directory and specify the name of the target file. The following formats are available: *.wmf (Windows Meta File), *.bmp (Bitmap) and *.jpg (JPEG file).
|
This function copies the diagram to the clipboard as a pixel graphic in bitmap (*.bmp) format.
|
This function copies the diagram to the clipboard as a vector graphic in Windows Metafile (*.wmf) format.
|
This option exports the curve points to an Excel file.
|
|